Revenue & Retention Analytics
2026-07-18
An advanced-SQL investigation into why a subscription business's revenue growth was slowing while signups hit records, ending in a campaign A/B test.
sql window functions cohort analysis a/b testing
Problem
Signups were at record highs while revenue growth kept slowing. Leadership needed to know why, and whether a win-back campaign was worth repeating. It is a business-question-driven SQL project: schema first, then progressively harder queries, each tied to the decision it informs.
Data
Nordwind subscriptions (synthetic) (Synthetic 5-table warehouse, openly disclosed and documented)
Approach
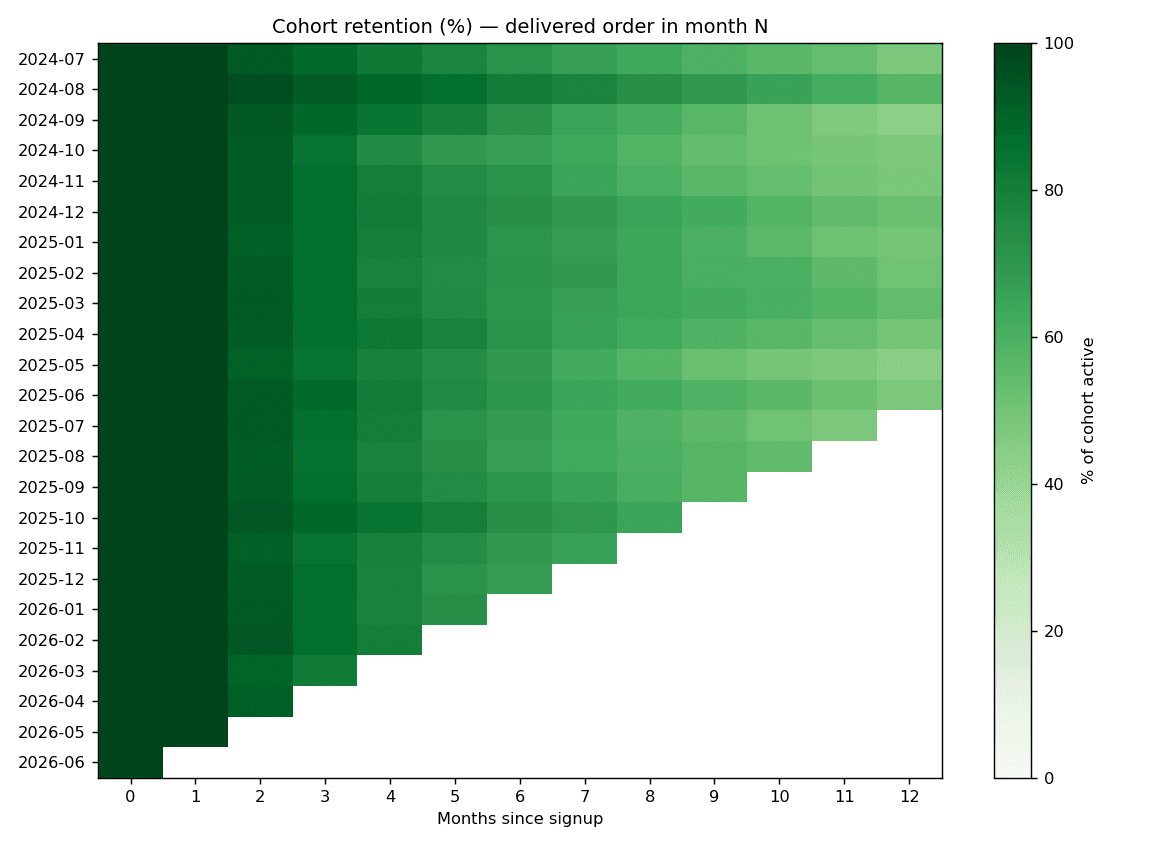
A five-table SQLite warehouse with an audited SQL cleaning layer (duplicates collapsed with window functions, channels normalized, impossible dates excluded) so every exclusion traces to a documented data-quality finding. Then cohort retention, a new/retained/reactivated revenue decomposition via window functions, channel lifetime value, and a randomized win-back campaign read out with a two-proportion z-test.
Result
The acquisition mix had shifted to paid channels whose customers were worth about 40% less (€218 vs €370 lifetime) and churned two to three times faster, a leaky bucket behind the flat top line. The campaign produced a real but modest 2.1-point renewal lift (n≈4,000, p≈0.002), delivered with practical-significance caveats in a one-page executive summary.
demo video
a short recorded walkthrough goes here once the project is complete
What I'd do differently
The data is synthetic, so the magnitudes demonstrate method rather than market fact. With real marketing-spend data I would compute LTV to CAC by channel, since revenue alone cannot say a channel is unprofitable, only that it is the weakest per customer.